Before Biden runs up the debt, he should read Proverbs

“In the house of the wise are stores of choice food and oil, but a foolish man devours all he has.”
Proverbs 21:20 NIV
In the field of personal financial planning, we apply this verse all the time when we tell clients to maintain a cash reserve of at least three to six months of living expenses. Having cash reserves in our time is equivalent to having food and oil in storehouses. In the wisdom literature of Proverbs, when it is “wise” to do one thing the implication is that it is “unwise” or “foolish” to do the opposite. Therefore, since it is wise to maintain healthy storehouses of supplies, it is foolish to have nothing in one’s barn.
This principle – like just about every principle that applies to personal finances – applies equally to states and nations. Therefore, a wise nation maintains a storehouse or reserves. Likewise, a foolish nation spends or consumes all that they take in.
Here in North Carolina, the state is required to save 15% of each year’s tax revenue growth for it to be set aside in the state’s “Rainy Day Fund”. This our state’s storehouse. Leading up to the Covid Recession, multiple sources listed North Carolina as well-prepared for an economic emergency. One such source was Moody’s Analytics. You can find their infographic here, which listed North Carolina as “Highly Prepared for Moderate Recession, Mostly Prepared for Severe Recession.” The infographic is from their 2018 Stress-Testing Study.
While it is encouraging to know that many of our nation’s states have similar laws mandating a reserve of some variety, sadly, the federal government does not. That has resulted in the federal government spending everything it collects in taxation and leaving nothing for the inevitable rainy day.
In personal financial planning, we see “bad” debt being created for one of two reasons. There is either a spending problem – i.e., the individual is spending more money than they make – or they experienced an emergency during a period when there were no cash reserves on hand.
During our nation’s early years, when debt was created, it was solely done for emergency purposes – usually war. After the war’s conclusion, we typically paid down that debt. Somewhere along the lines, we have lost that tradition. To compound the issue, we have also developed a spending problem.
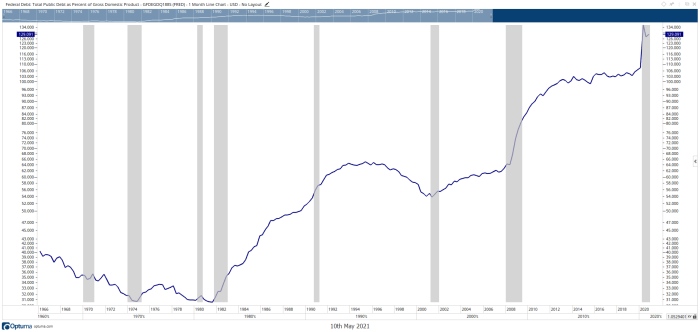
The chart below is sourced from the Federal Reserve Economic Database, affectionately referred to as FRED. This official government data shows our nation’s debt as a percentage of our nation’s Gross Domestic Product. Our debt is currently 129% of our nation’s economic output.

To put this into proper perspective, imagine sitting down to review your financial plan and realizing that you have accumulated $129,000 in credit card debt while only having a salary of $100,000. To someone making $1,000,000 in income per year, that $129,000 in credit card debt might be manageable. However, for the person making $100,000 in annual income, the $129,000 credit card debt is likely to be a very large problem that needs to be addressed. Ultimately, there are only two ways to pay down debts. You either reduce your spending or increase your revenue.
When it comes to our nation’s debt problem, we often hear that we need a balance of the two approaches. Let’s look at the tax argument first.
President Biden has proposed a tax increase. Some have argued that his proposal, if enacted, would be the largest tax increase since 1993 or 1968 (depending on who you read). One of my favorite verses is 1 Peter 3:15b. It reads “Always be prepared to give an answer to everyone who asks you to give the reason for the hope that you have. But do this with gentleness and respect.” While Peter is obviously talking about the hope that we have in Christ (see the first part of the verse), we can certainly apply this principle to our daily lives. We should be able to defend our beliefs with sound reason articulated with “gentleness and respect”. So, while you might be immediately for or against President Biden’s tax increase proposal, can you defend your position with reason?
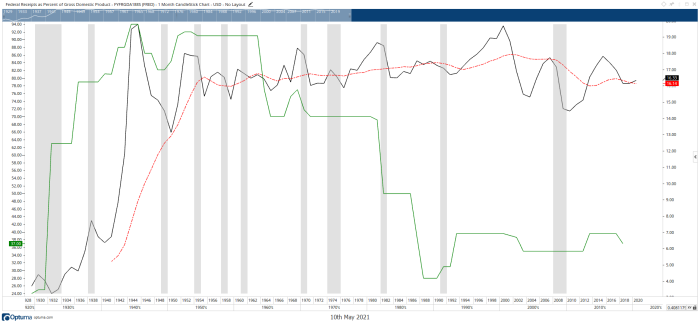
The chart below is again sourced from FRED, so it is official government data. While I have combined the data into one chart, each dataset can be verified by visiting the FRED website. The hyperlinks are in the footnotes.

The gray vertical bars represent official recessions as determined by the National Bureau of Economic Research. The green line illustrates the highest income tax rate over time. The scale on the left side of the chart shows us that, for example, in 1944 and 1945, the highest income tax rate at the time was 94%. Likewise, we see that the current highest income tax rate is 37%.
The black line uses the scale on the right side of the chart, and it illustrates the federal receipts (tax revenue) as a percentage of Gross Domestic Product. The red dashed line is a 12-year simple moving average in an attempt to smooth out the swings.
By putting all this information onto a single chart, we see that our tax revenue has never exceeded 20% of Gross Domestic Product – at least not since 1930 which is the earliest date that we have data for all datasets. In 1950, tax receipts were a little more than 13% of our nation’s GDP. However, since 1951 tax receipts as a percentage of GDP have been relatively steady, swinging from ~15-18% most of the time. This is despite a somewhat steady decline in the top tax rate.
From this study, we can conclude that the federal government takes in approximately 16% of GDP in tax revenue regardless of the top tax rate. Therefore, in order to address the massive debt that our nation has been steadily accumulating since the 1982 recession, our nation’s leaders should be focusing on ways to increase our nation’s output and not on our nation’s top tax rate.
If history is our guide – and it should be – then raising the tax rates per the President’s proposal should yield approximately 16% of our GDP in tax revenues. If the President and Congress leave the tax rates alone, the same appears to be true. Raising tax revenues by increasing tax rates appears to be a fallacy.
In looking at this data, it is also interesting to note that the revenue collected is eerily similar to a flat tax rate. Regardless of tax rates, it certainly appears that the revenue generated is a fairly steady 15-18% of GDP. One could make a case for a flat tax being biblical. Isn’t it interesting that it appears that God’s natural order of the economy seems to also suggest that a flat tax is a natural outcome?
Chart Sources: Federal Reserve Economic Data (FRED) via Optuma.
Chart One is the Total Public Debt as a Percentage of GDP. You can find the chart on the St. Louis Fed website here.
Chart Two illustrates:
Green Line – US Individual Income Tax: Tax Rates for Regular Tax: Highest Bracket, found here.
Black Line – Federal Receipts as Percent of Gross Domestic Product, found here.
C. Theodore Hicks II, CFP®, CKA®, CMT® is the Founder, CEO and Chief Investment Officer for Hicks & Associates Wealth Management.


