3 Views: Who's Winning, Clinton or Trump?

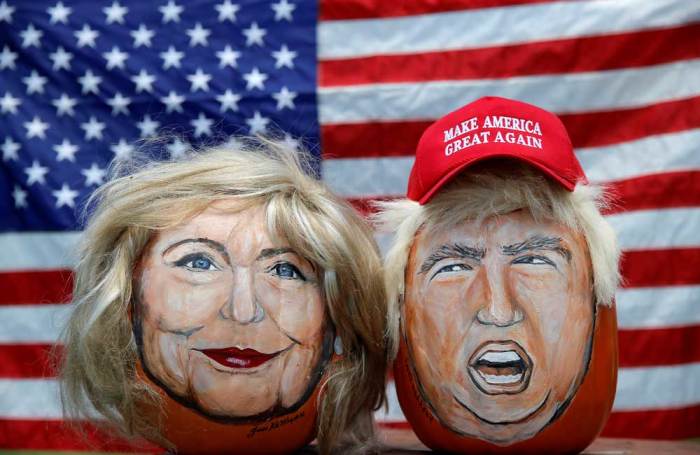
Come November, the two people most likely to be elected president are Democratic Party nominee Hillary Clinton and Republican Party nominee Donald Trump.
Although both Clinton and Trump have historic unfavorable ratings among voters, both lead all possible third party challengers.
Going into September, which of the two is seen as winning the presidential election? Three different analyses offer insight.
1. Real Clear Politics
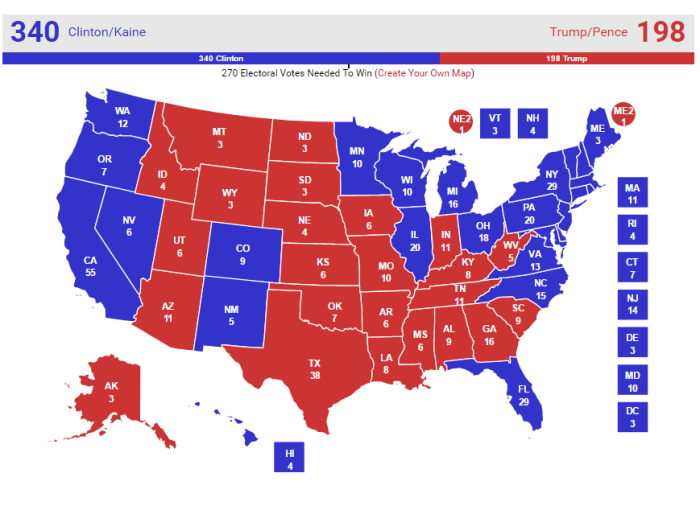
Currently, on their "no toss up states" map Real Clear Politics points to a landslide victory for the Clinton campaign, with the Democratic hopeful securing 340 electoral points versus Trump's 198.
Based off of voter data from various sources, this map has Clinton winning not only the usual Democrat strongholds of the West Coast and New England, but also key southern states like Florida, North Carolina, and Virginia.

When toss ups are factored, the Clinton campaign still has more electoral points secured, albeit not enough fully secured to meet the 270 minimum to win the election.
RCP's toss up map gives Clinton 229 points, Trump 154 points, and puts as "up for grabs" 155 electoral points. States that could go either way on this map include the Commonwealth of Virginia, the very state Democratic vice presidential running mate Tim Kaine has served as both governor and U.S. Senator.
2. Polly Vote
The election forecasting website Polly Vote had a less decisive outcome for November. In an entry published on Labor Day, the site labeled the Clinton-Trump race a "dead heat."
"The Keys to the White House model published an updated forecast of the election outcome. The model currently forecasts a two-party vote share of 51.5% for Clinton, and 48.5% for Trump," noted Polly Vote.
"The most recent Polly Vote forecasts Clinton to gain 53.0% of the two-party vote. The results of the Keys to the White House model for Clinton are thus 1.5 percentage points below the combined PollyVote."
PollyVote's methodology for its "Keys to the White House" model is built on the concept of "the theory of pragmatic voting."
"America's electorate, according to this theory, chooses a president, not according to events of the campaign, but according to how well the party in control of the White House has governed the country," explained Polly Vote's site.
"If the voters are content with the party in power, it gains four more years in the White House; if not, the challenging party prevails."
3. Five Thirty Eight

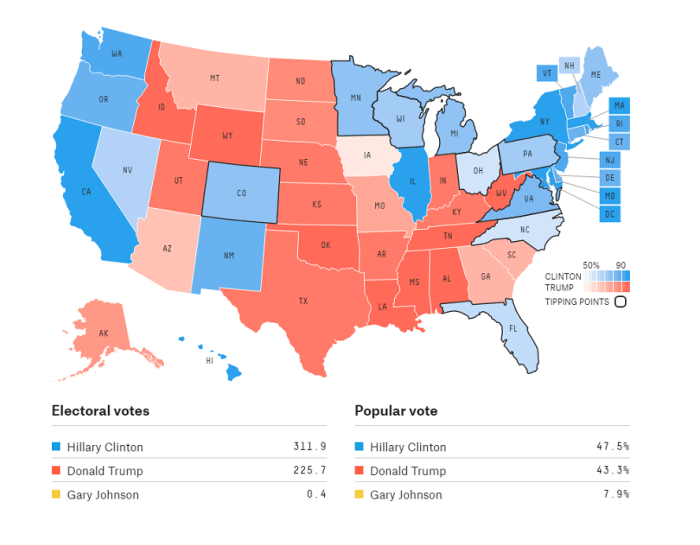
FiveThirtyEight also projects Clinton to be victorious in November. In an electoral map updated on Monday, the site found a 71.1 percent chance of Clinton winning, versus a 28.9 percent chance of Trump winning.
Their likely scenario involved Clinton getting 311.9 electoral votes, Trump getting 225.7 electoral votes, and Libertarian Party nominee Gary Johnson getting 0.4 electoral votes.
Their scenario also included Clinton getting 47.5 percent of the popular vote, followed by Trump with 43.3 percent, and Johnson with 7.9 percent.
FiveThirtyEight bases their forecast on simulating the presidential election 10,000 times, according to their website: "We'll be updating our forecasts every time new data is available, every day through Nov. 8."


